Data
[ADD SUMMARY BRIEFLY DESCRIBING TRENDS]
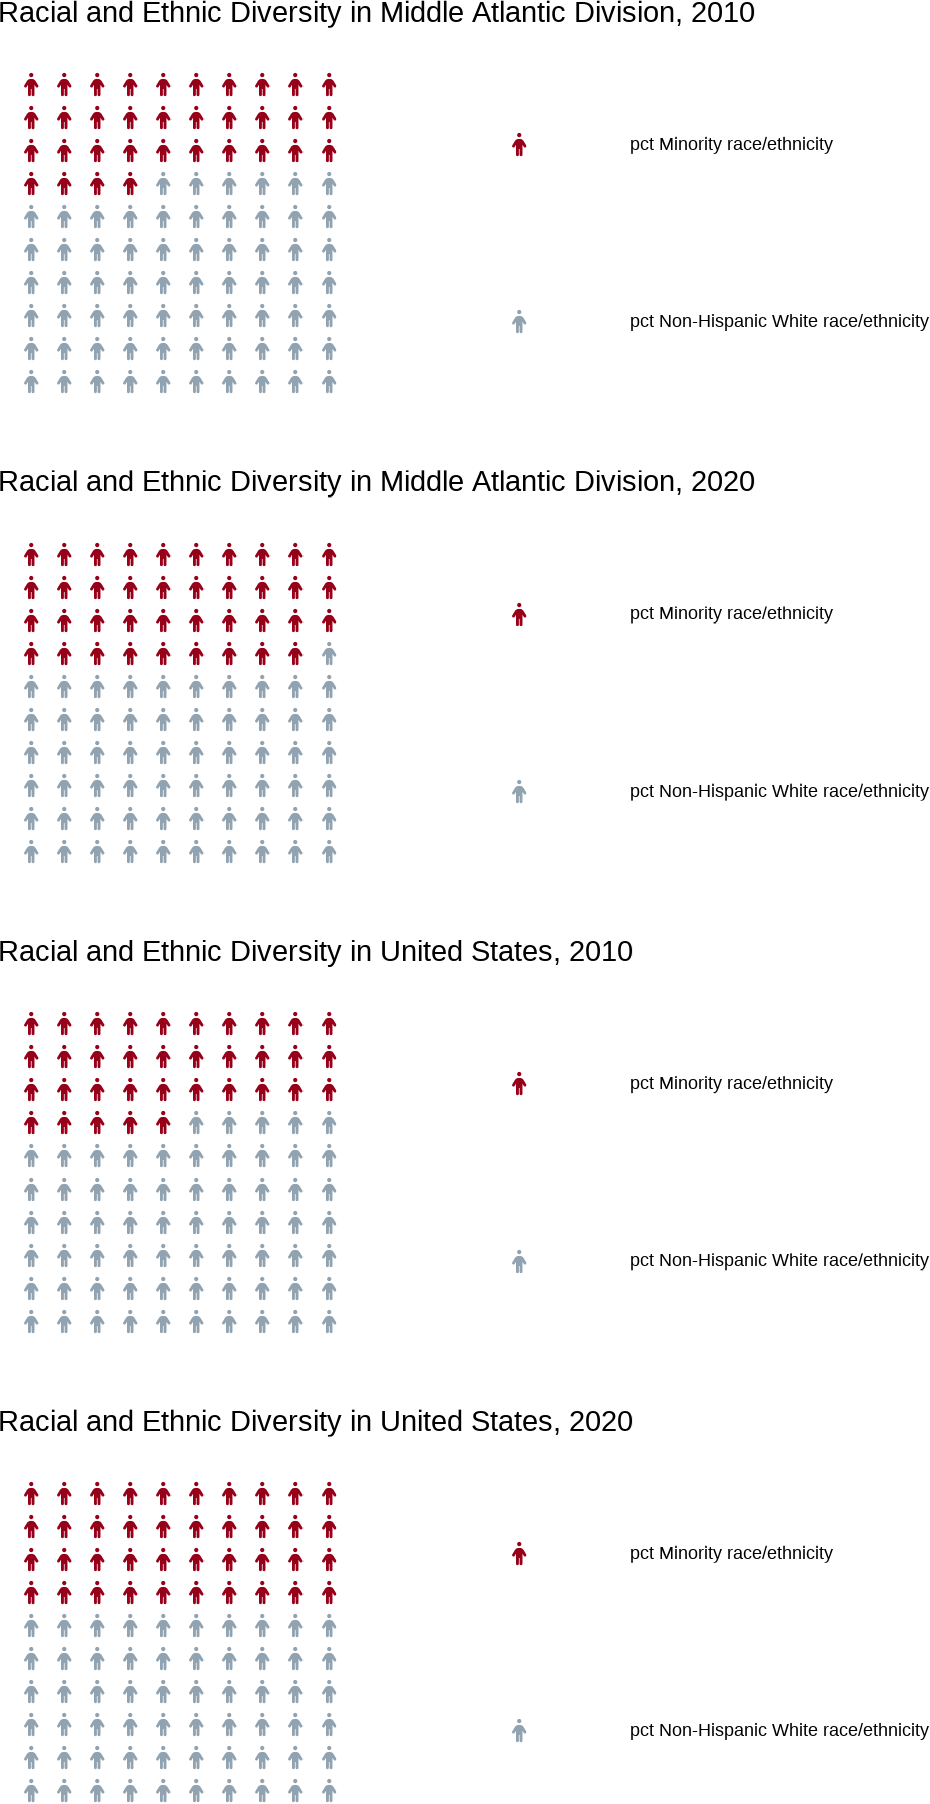
| division | year | pct in poverty | pct not in poverty | pct unemployed | pct employed | pct housing cost-burdened | pct not housing cost-burdened | pct adults without high school diploma | pct adults with high school diploma | pct age 17 & under | pct age 18-64 | pct age 65+ | pct single parent families | pct other families | pct limited English speakers | pct proficient English speakers | pct Minority race/ethnicity | pct Non-Hispanic White race/ethnicity | pct in multi-unit housing | pct in mobile housing | pct in other housing | pct in crowded living spaces | pct in non-crowded living spaces | pct with no vehicle access | pct with vehicle access | pct in group living quarters | pct not in group living quarters | pct without health insurance | pct with health insurance | pct disabled civilians | pct not disabled civilians |
|---|---|---|---|---|---|---|---|---|---|---|---|---|---|---|---|---|---|---|---|---|---|---|---|---|---|---|---|---|---|---|---|
| United States | 2010 | 23 | 77 | 8 | 92 | 36 | 64 | 15 | 85 | 24 | 63 | 13 | 17 | 83 | 5 | 95 | 35 | 65 | 13 | 7 | 80 | 3 | 97 | 9 | 91 | 3 | 97 | 15 | 85 | 15 | 85 |
| Middle Atlantic Division | 2010 | 20 | 80 | 8 | 92 | 39 | 61 | 14 | 86 | 23 | 63 | 14 | 16 | 84 | 5 | 95 | 34 | 66 | 18 | 3 | 79 | 3 | 97 | 19 | 81 | 3 | 97 | 11 | 89 | 14 | 86 |
| United States | 2020 | 21 | 79 | 5 | 95 | 30 | 70 | 11 | 89 | 22 | 62 | 16 | 16 | 84 | 4 | 96 | 40 | 60 | 14 | 6 | 80 | 3 | 97 | 8 | 92 | 2 | 98 | 9 | 91 | 15 | 85 |
| Middle Atlantic Division | 2020 | 19 | 81 | 6 | 94 | 34 | 66 | 11 | 89 | 21 | 62 | 17 | 15 | 85 | 5 | 95 | 39 | 61 | 20 | 2 | 78 | 4 | 96 | 19 | 81 | 3 | 97 | 6 | 94 | 14 | 86 |
Socieconomic Status Infographics
[SUMMARY OF INFOGRAPHIC]

Alt-text: Socioeconomic Status Infographic
Household Characteristics Infographics
[SUMMARY OF INFOGRAPHIC]

Alt-text: Household Characteristics
Infographic
Racial and Ethnic Minority Status Infographics
[SUMMARY OF INFOGRAPHIC TEXT]

Alt-text: Racial and Ethnic Minority
Infographic
Housing Type and Transportation Infographics
[SUMMARY OF INFOGRAPHIC]

Alt-text: Housing and Transportation
Infographic
2010 SVI Flag to Population Ratio Map
[TEXT DESCRIBING MAP]
2020 SVI Flag to Population Ratio Map
[TEXT DESCRIBING MAP]